Develop in the local web IDE
The normal build loop is a terminal loop. You edit a flowgroup in your editor,
run lhp validate, run lhp generate, scroll the output, open the
generated Python to see what changed, then switch back to the YAML. You edit one
file at a time and hold the rest of the pipeline — the dependency graph, the
generated Lakeflow, the errors — in your head.
lhp web puts that loop in one place. It serves a browser-based workbench for
a single project on your own machine: explore every pipeline, edit a flowgroup’s
actions in a form with schema-aware validation, watch the dependency graph
redraw as you save, read the generated Lakeflow code next to the YAML that
produced it, and run validate and generate with output streaming live.
The declarative YAML and the generated code are exactly what the CLI produces —
a guided visual workspace instead of hand-editing YAML and re-running the CLI
blind.
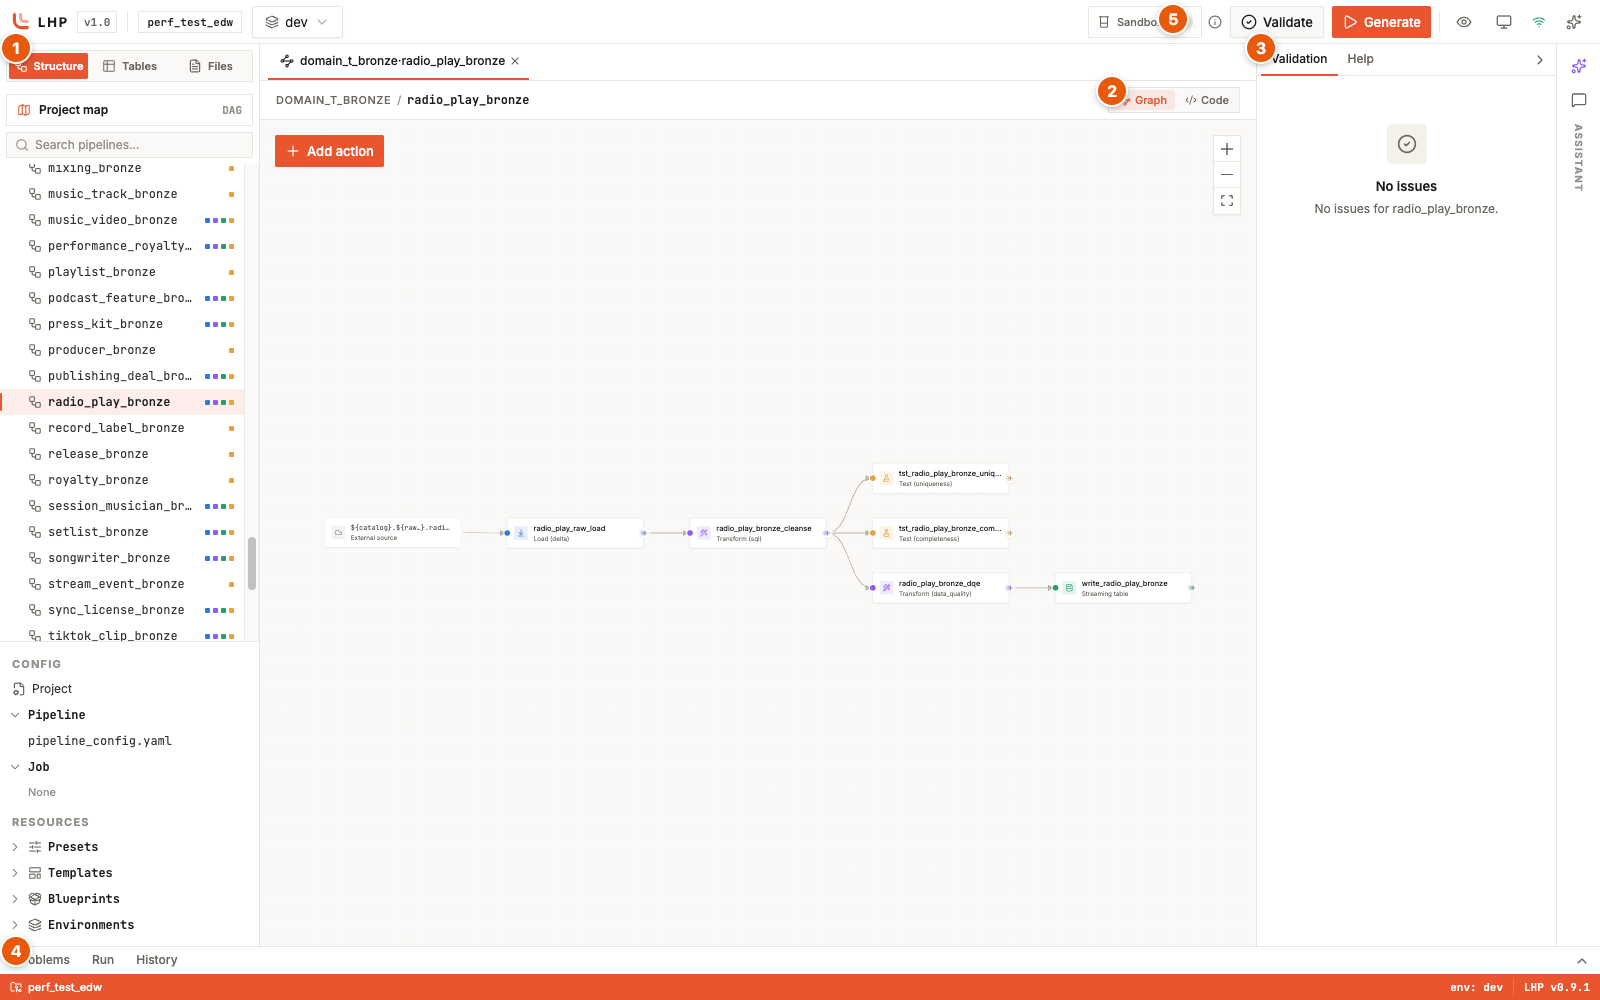
The workspace with radio_play_bronze open: ① the entity explorer, ② the
Graph/Code toggle over the canvas, ③ the Validation inspector, ④ the
Problems/Run/History panel, ⑤ the Sandbox toggle in the header.
Let’s install the extra, launch it, and walk the project from the explorer to a
live generate run.
Install the web extra
The web IDE is an optional install. It pulls in a FastAPI server and uvicorn, so it ships as an extra rather than a core dependency:
pip install "lakehouse-plumber[webapp]"
Without the extra, lhp web stops immediately with error LHP-IO-026 and
tells you to install it. The browser app itself ships pre-built inside the
package — you do not need Node.js or any front-end build step.
You also need an initialized project — a directory with an lhp.yaml, your
pipelines/, and your substitutions/. To start the IDE in an empty
directory instead, see Start from an empty directory below.
Launch the IDE
From anywhere inside your project, run:
$ lhp web
Starting Lakehouse Plumber web IDE at http://127.0.0.1:8000/#token=<session-token>
The server binds 127.0.0.1 only — it is loopback-only and never listens on a
network interface. Once it answers its health probe, your browser opens on the
printed address. The #token= fragment carries a per-session access token:
every request but the health check needs it, and a fresh token is minted on each
launch, so enter through the printed URL rather than a bookmark.
Port 8000 is the default. If it is already in use, the launch fails with
LHP-IO-027 — pick a free one:
lhp web --port 8001
Pass --no-open to suppress the browser and click the printed URL yourself.
--reload restarts the server when LHP’s own source changes and matters only
when you are developing LHP itself. For the full, generated flag list, see the
CLI reference at CLI.
Explore the project
The left entity explorer is where you find things. It has three lenses, switched from the tabs at its top.
Structure is the default: it lists your pipelines, and each pipeline expands to its flowgroups. Below the pipelines sit a Config group (Project, Pipeline, Job) and a Resources group (Presets, Templates, Blueprints, Environments) — every configurable surface of the project in one tree. The Project map / DAG button at the top jumps to the whole-project graph.
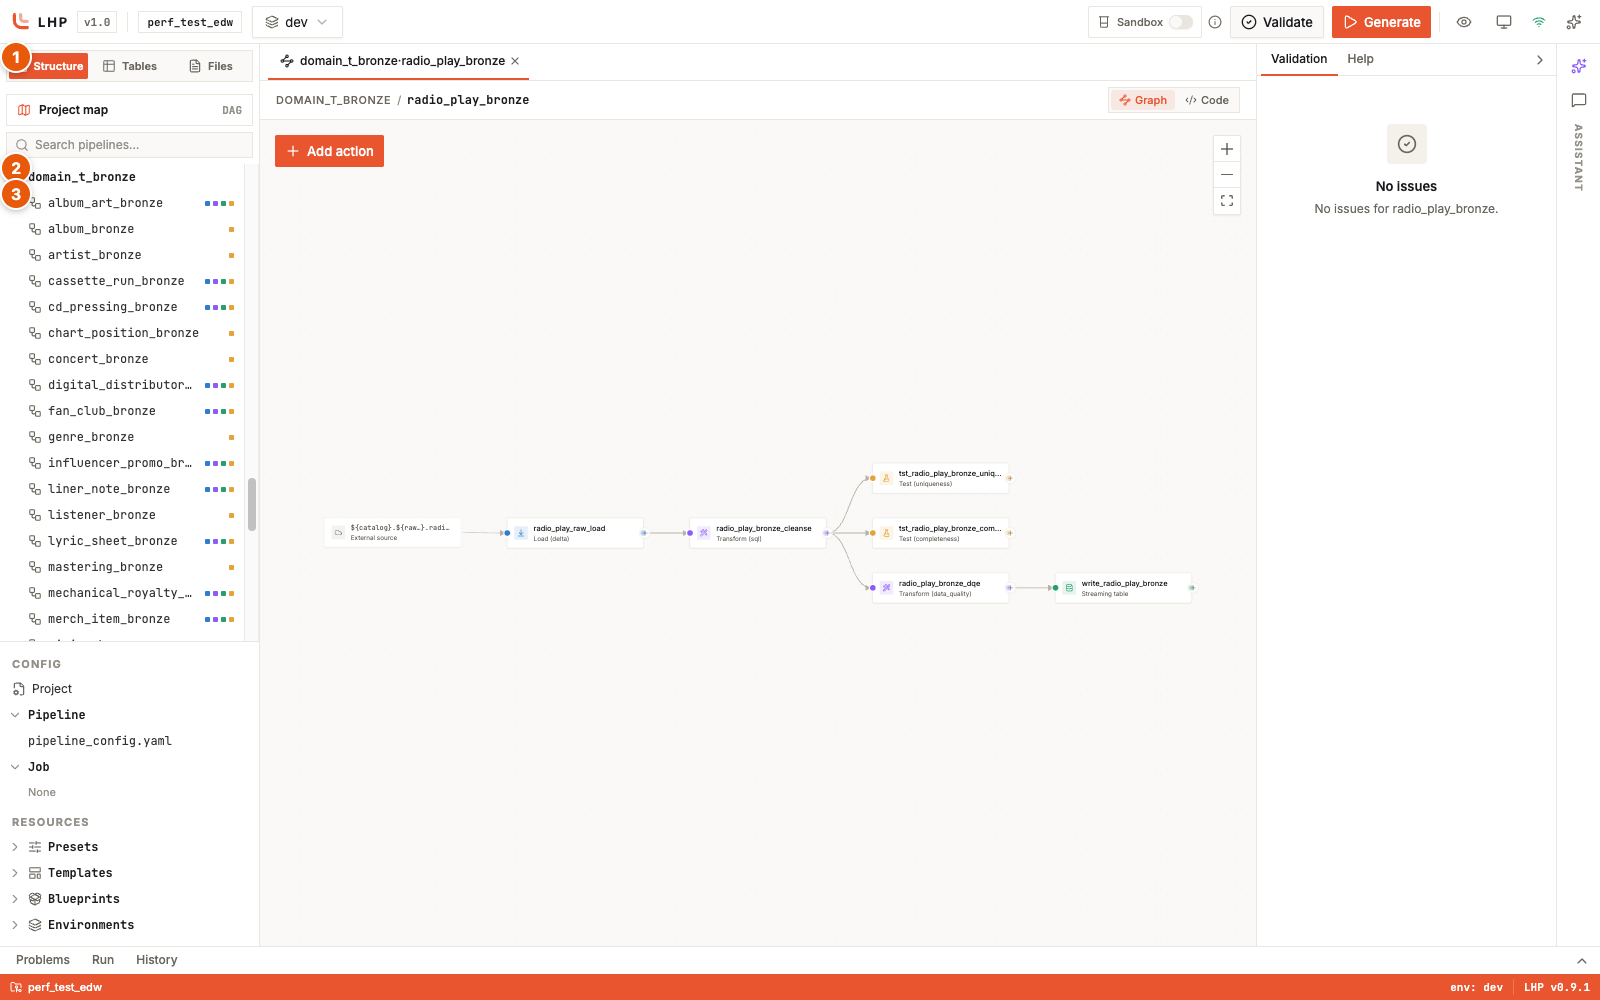
The Structure lens: ① the Structure tab, ② a pipeline (domain_t_bronze),
③ one of its flowgroups. Config and Resources groups sit below the pipeline
tree.
Files shows the raw project file tree and lets you create a new flowgroup, create a file, or delete one — the escape hatch for anything the structured views do not reach.
Tables answers a different question: what does this project actually write?
It lists every table and view the project produces, grouped by target namespace
(catalog.schema), each row pairing the dataset name with the physical table
it lands in. Search it to find where a table is defined without walking the
pipeline tree.
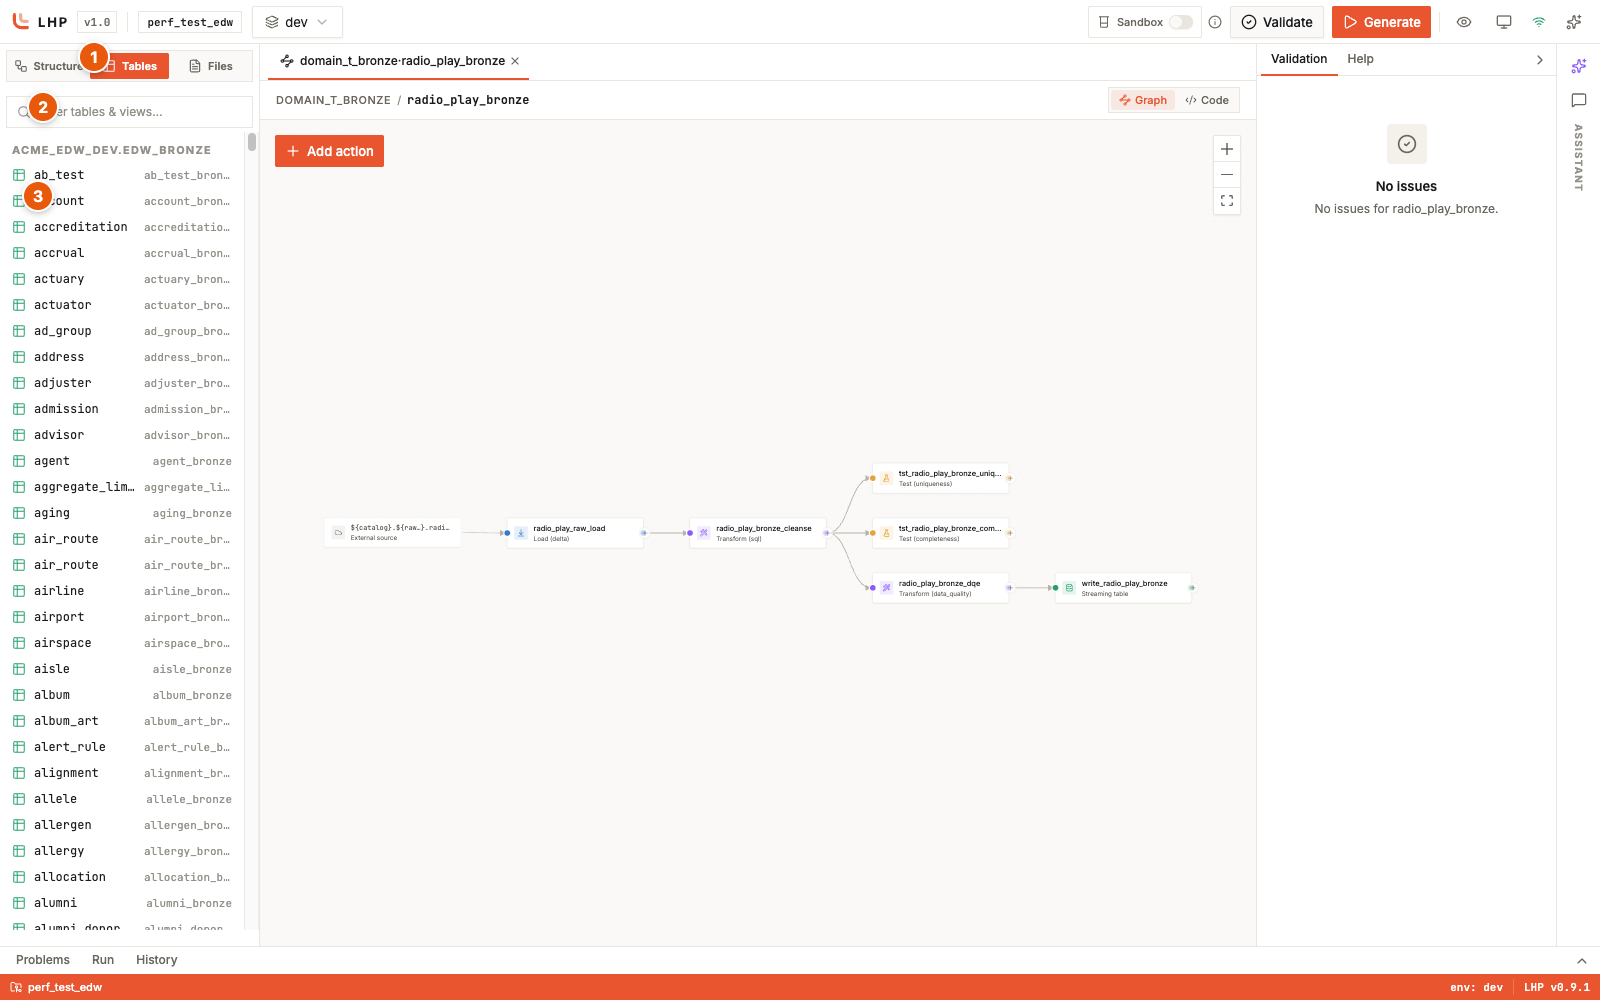
The Tables lens: ① the Tables tab, ② the search box, ③ a dataset entry. Every table and view the project writes, grouped by target namespace.
See a pipeline as a graph
The terminal loop makes you reconstruct dependencies by hand. The IDE draws them. Click Project map to open the project graph: every pipeline as a node, edges tracing which pipeline feeds which. Filter to one pipeline, restrict to nodes with problems, or toggle external sources on and off from the toolbar; a legend distinguishes internal, cross-pipeline, and external edges.
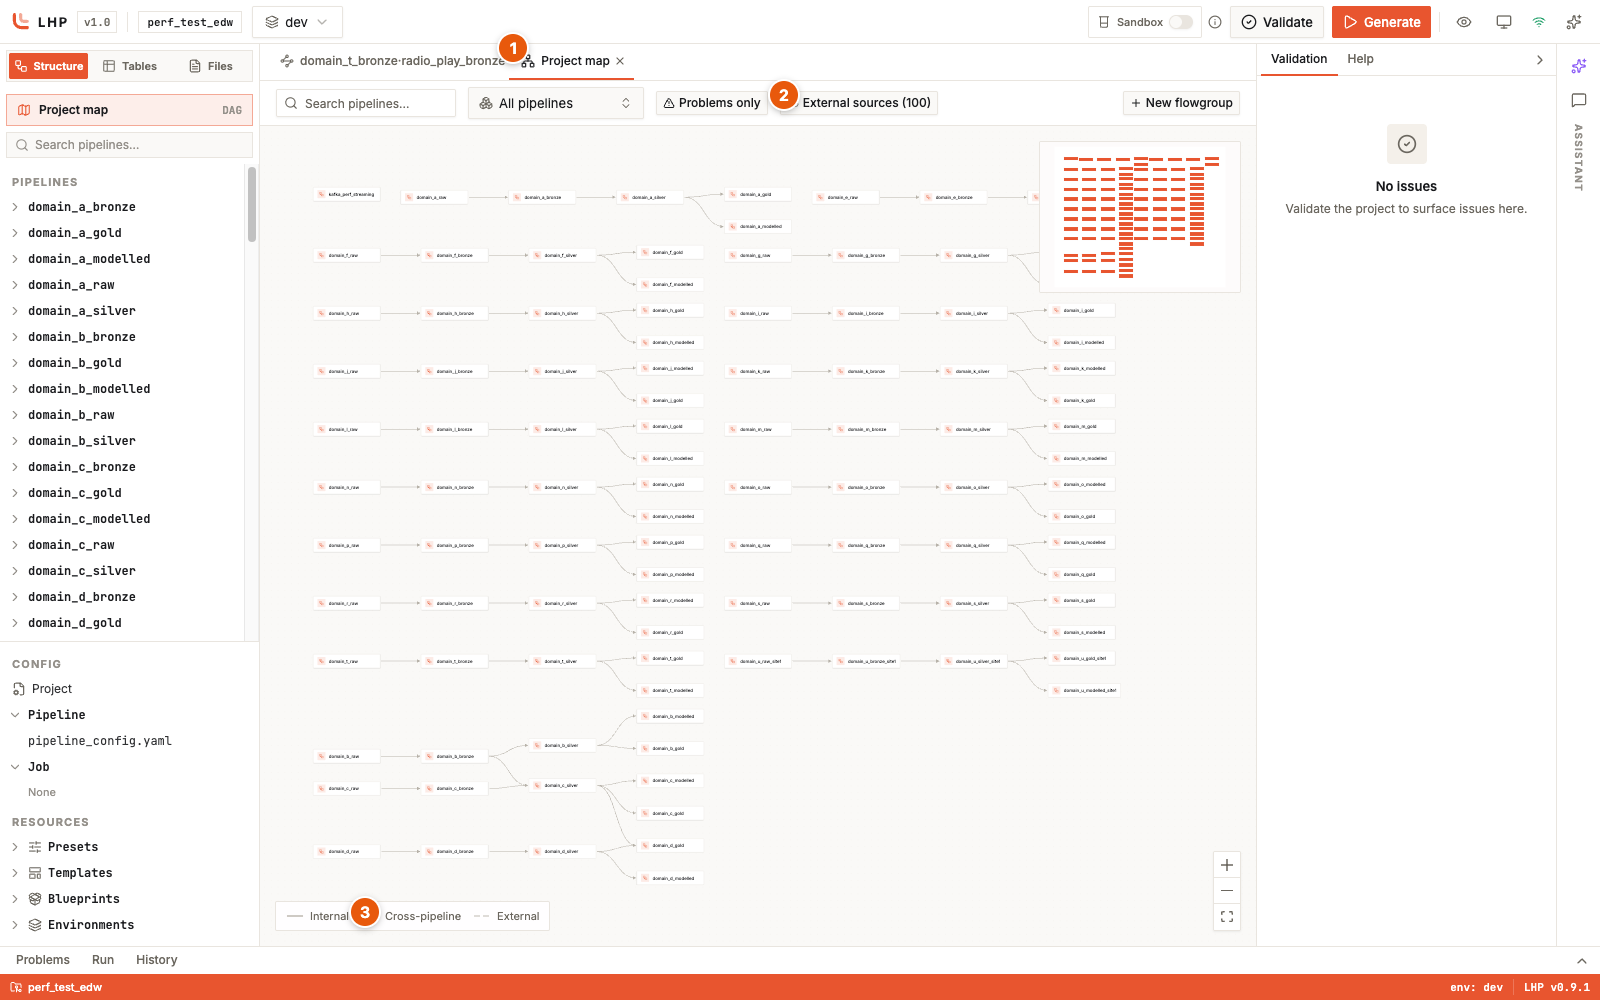
The project map: every pipeline as a dependency graph. ① the Project map tab, ② the External-sources toggle, ③ the edge-type legend (internal / cross-pipeline / external).
Open a flowgroup
Select a flowgroup from the explorer to open it on the canvas. The featured one here is radio_play_bronze in pipeline domain_t_bronze — a streaming Delta load, a SQL cleanse, a data-quality check, and a write.
The Graph | Code toggle over the canvas switches between two views of the
same flowgroup. Graph draws the action chain: an external source feeds
radio_play_raw_load (a Delta load), which feeds radio_play_bronze_cleanse
(a SQL transform), which feeds radio_play_bronze_dqe (a data_quality
transform) and on to write_radio_play_bronze (the streaming table). The
graph also draws the implicit test nodes — Test (uniqueness) and
Test (completeness) — that the data-quality transform’s expectations
generate; they never appear in your YAML but they run against your data.
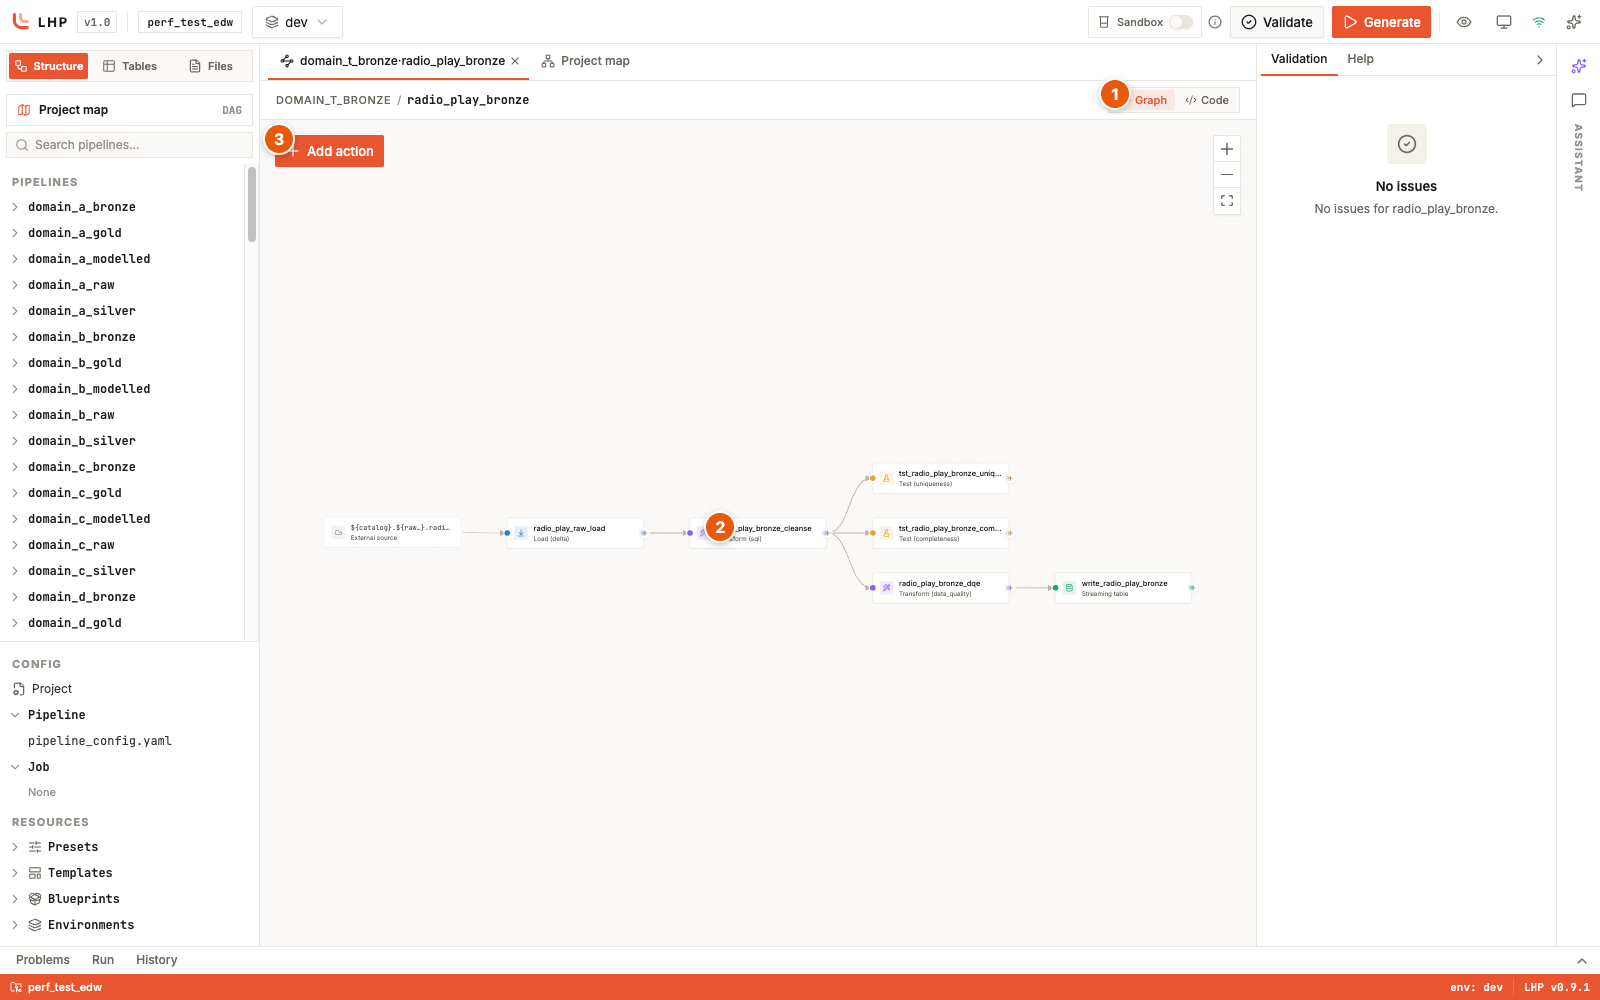
radio_play_bronze as its action chain: load → SQL transform →
data-quality transform → write, plus the implicit test nodes. ① the
Graph/Code toggle, ② an action node, ③ Add action to extend the chain.
Flip to Code to read the same flowgroup as text. The Code view opens the
source flowgroup YAML (editable, with a Save button), any files it
references — here an expectations JSON, shown read-only — and the generated
Lakeflow Python as further tabs. Generated code under generated/ is
read-only in the IDE: you browse it beside the YAML that produced it, you never
hand-edit it.
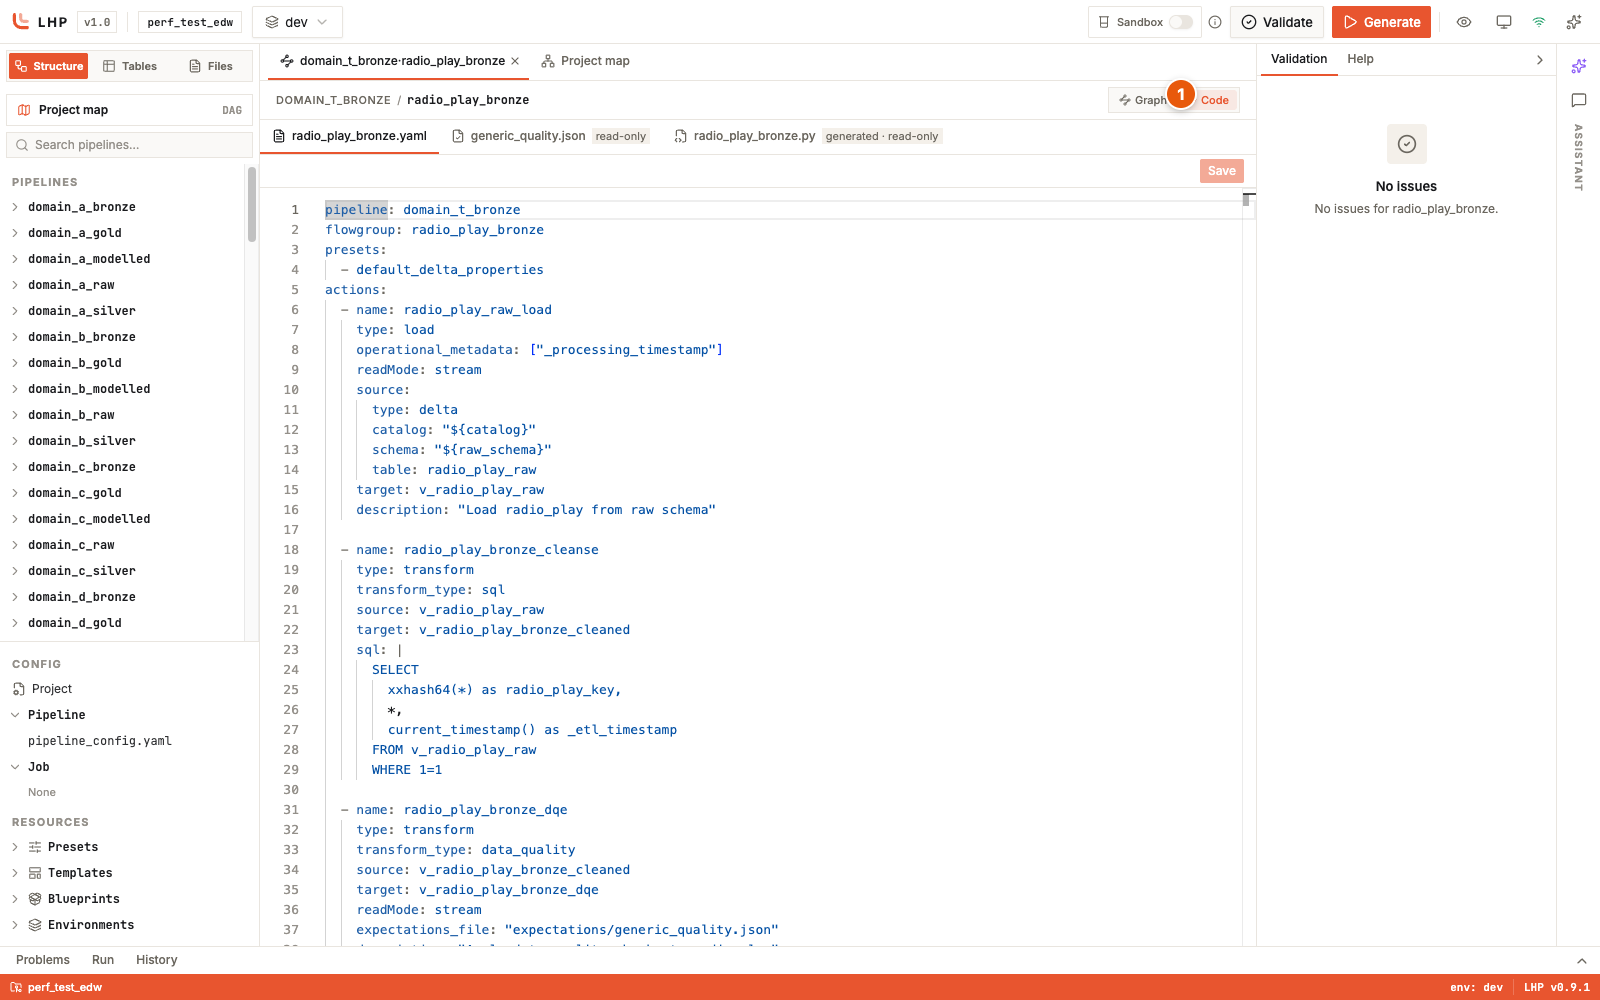
The Code view: the source YAML (editable, with Save), a referenced expectations file (read-only), and the generated Lakeflow Python (read-only), each as a tab.
A save always persists, even when the YAML is invalid — inline markers tell you what to fix, and the graph and validation redraw on every save.
Edit an action
Editing an action in raw YAML means remembering every field its type allows. The IDE lays them out for you. Click an action node in the Graph and the Edit action modal opens for that action.
Across the top sit source- and target-type tabs — Auto Loader (cloudFiles),
Delta table, SQL query, Python function, JDBC, Custom data
source, Kafka — so switching a load from cloud files to Delta is a click,
not a rewrite. Below the tabs are grouped fields: a Description, a Source
table group (Catalog, Schema, Table, each carrying its ${...} tokens with
a token-insert button), a Read group (read mode: stream or batch), a
collapsible Advanced group, and a Target group. Fill the fields and the
IDE writes the YAML for you.
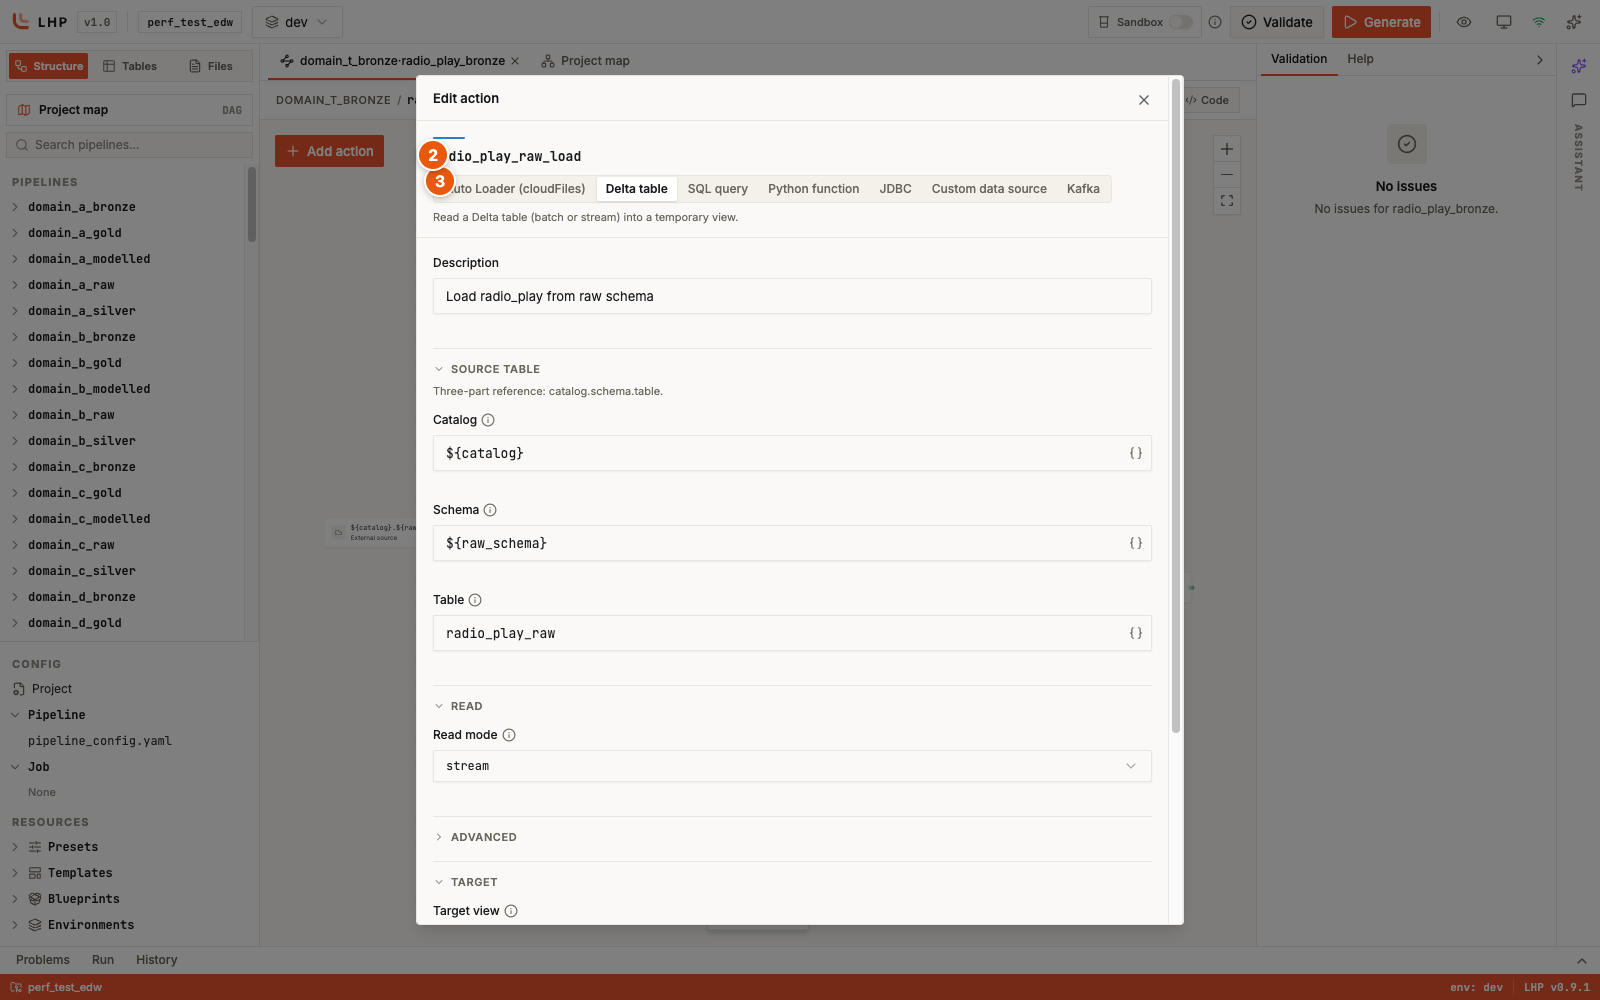
The Edit action modal for radio_play_raw_load: ② the action name,
③ the source-type tabs. The Source table group carries the ${catalog} and
${raw_schema} tokens; read mode is stream.
Field-level help lives in the (i) info icons beside each field. Hover the Catalog icon and the tooltip reads “Unity Catalog catalog name” — the definition of every field is one hover away, without leaving the form.
Edit configuration
Configuration files open with the same choice of surfaces: a Form | YAML
toggle in the top-right. Open lhp.yaml and the Form lays out project
identity and generation defaults — Name, Version, Description, Author, Created
date, Required LHP version, and an Apply-formatting toggle — followed by the
Includes glob patterns that select which YAML each generate run reads.
Flip to YAML when you want to edit the raw file. The same (i) tooltips
explain each field.
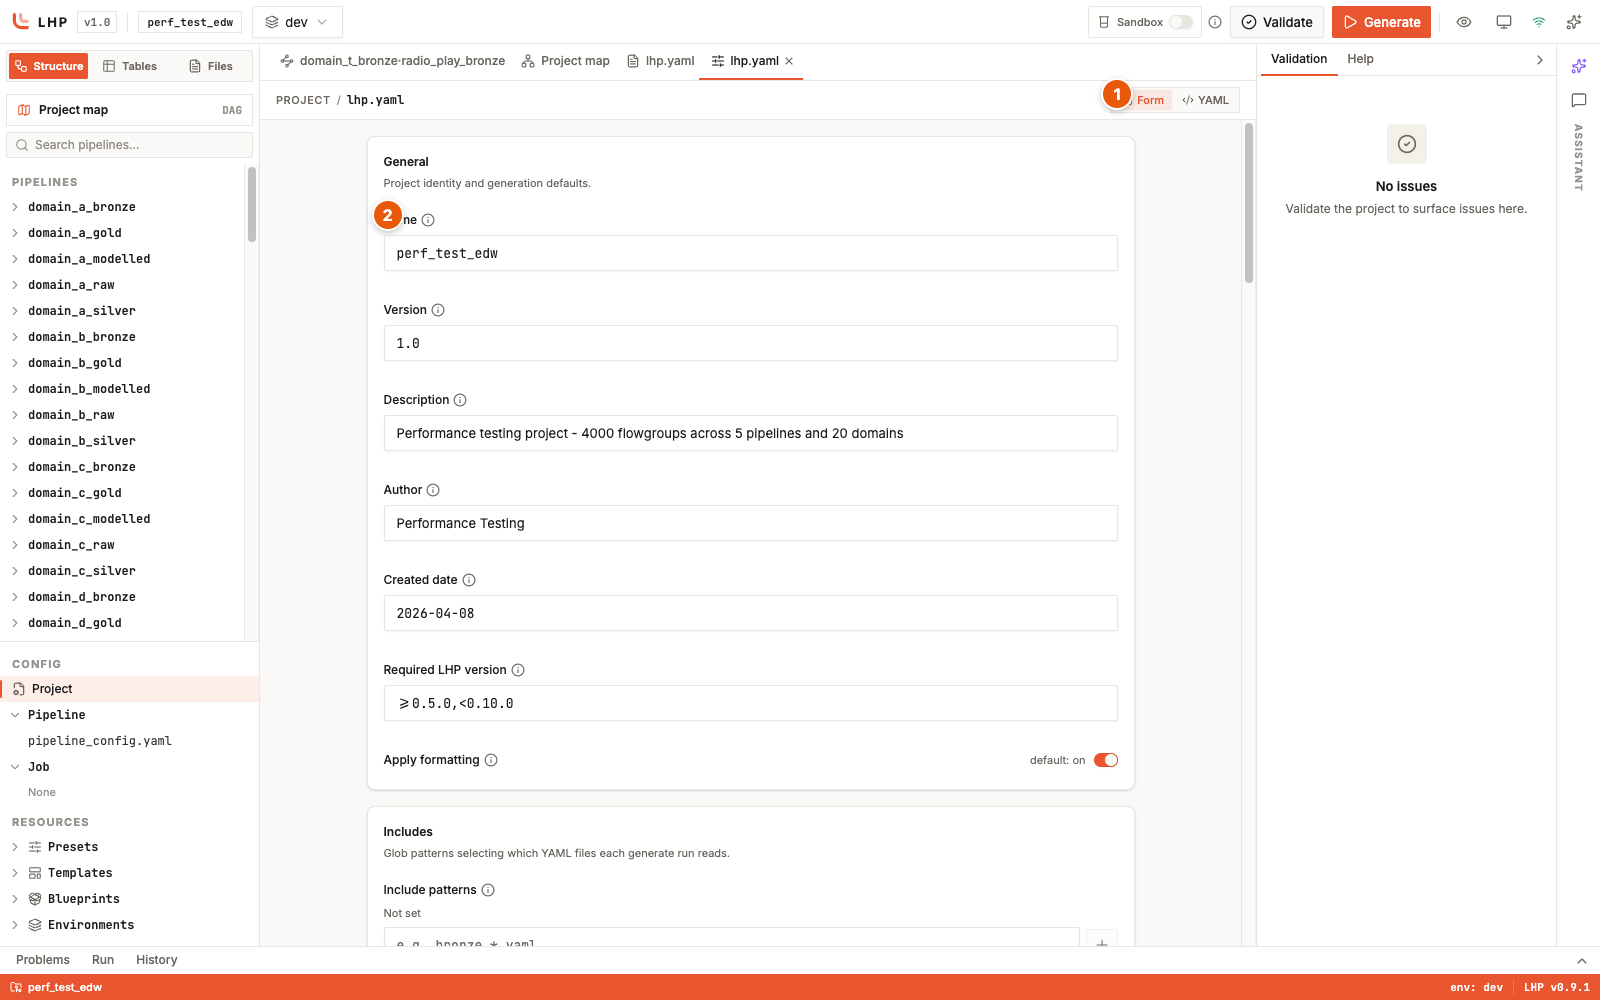
lhp.yaml as a form: ① the Form/YAML toggle, ② the Name field. The General
group holds project identity and generation defaults; Includes holds the
glob patterns.
Validate and generate
Run validate and generate from the browser instead of the terminal:
Pick an environment from the header selector, and optionally a single pipeline.
Click Validate or Generate. Output streams live into the Run panel at the bottom; the Problems tab lists every error and warning, and the History tab keeps past runs.
Generated code lands in
generated/<env>/— the same locationlhp generatewrites to. The IDE is not a second runtime; it drives the same generator.
A clean validation ends with “Validation completed successfully” in the Run panel and “Validated · no issues” in the footer.
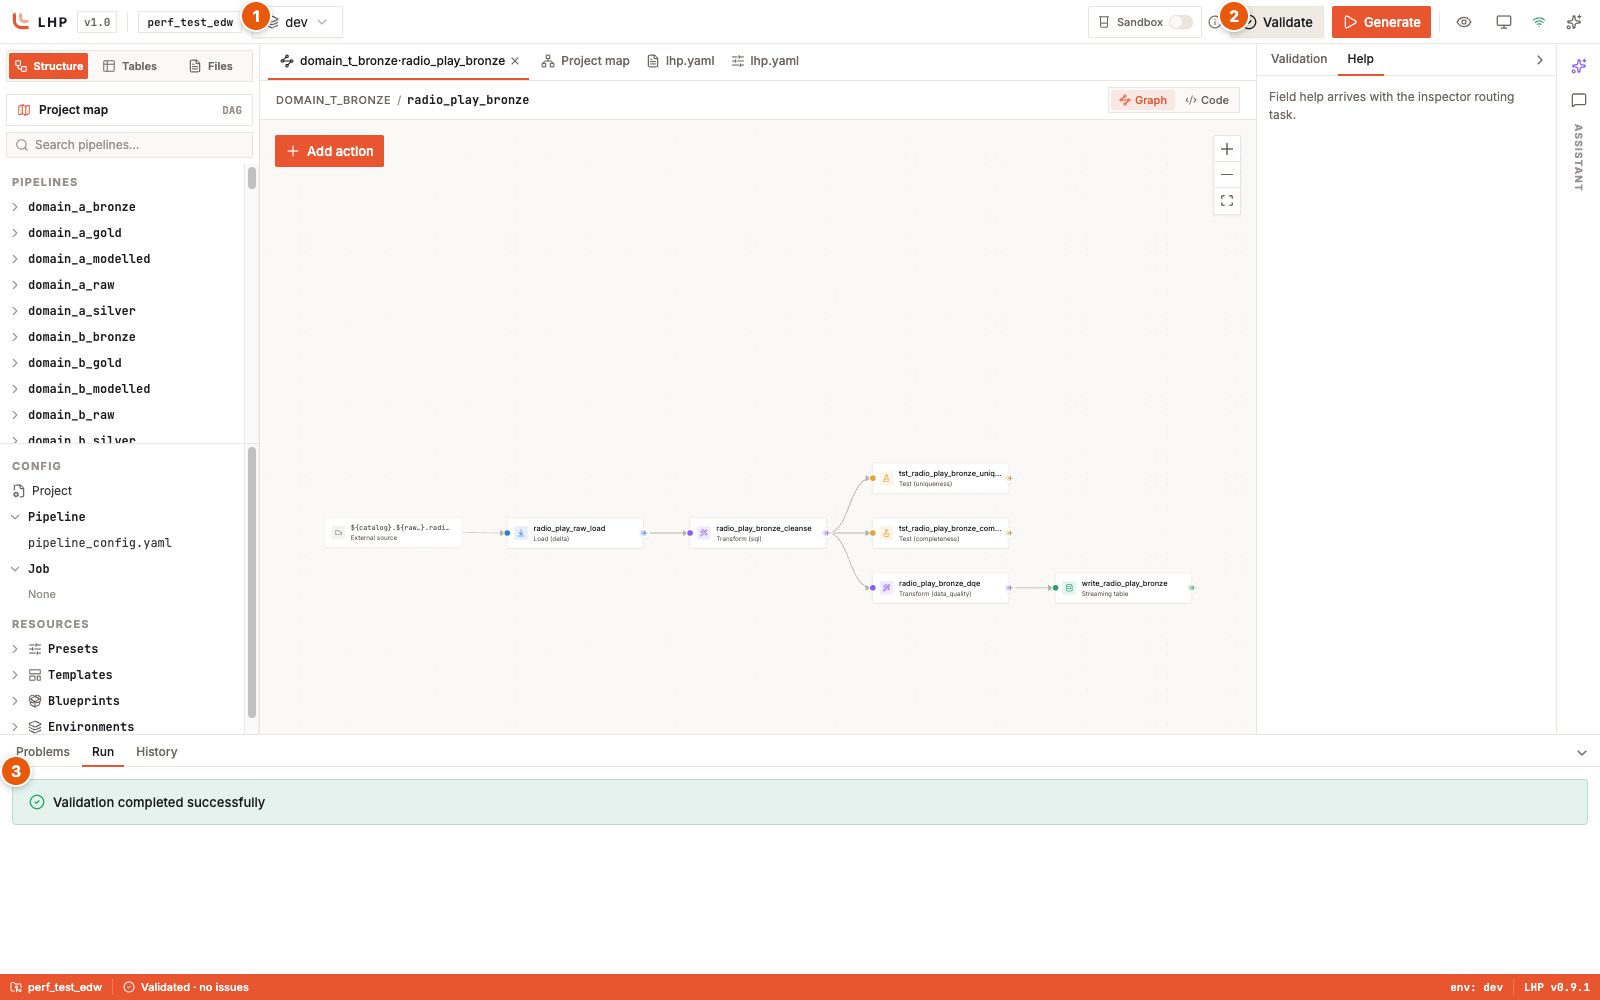
A validate run: ① the project and environment, ② the Validate button,
③ the Run panel with “Validation completed successfully”.
Note
With no pipeline configuration selected, IDE generation is a code-only
preview: it runs with Declarative Automation Bundles support off, so it
writes generated/<env>/ but no bundle resource files. For a deployable
bundle build, select a pipeline configuration for runs in the IDE, or run
lhp generate from the CLI.
Switch to the viewer lens and theme
The eye icon in the header toggles a read-only viewer lens. In it, a VIEWER badge sits next to the environment selector and every editing affordance is suppressed — you can walk the graph, read the generated code, and run validation, but you cannot change a file. Use it to hand the workspace to someone who should look, not edit, or to guard against a stray keystroke while reviewing.
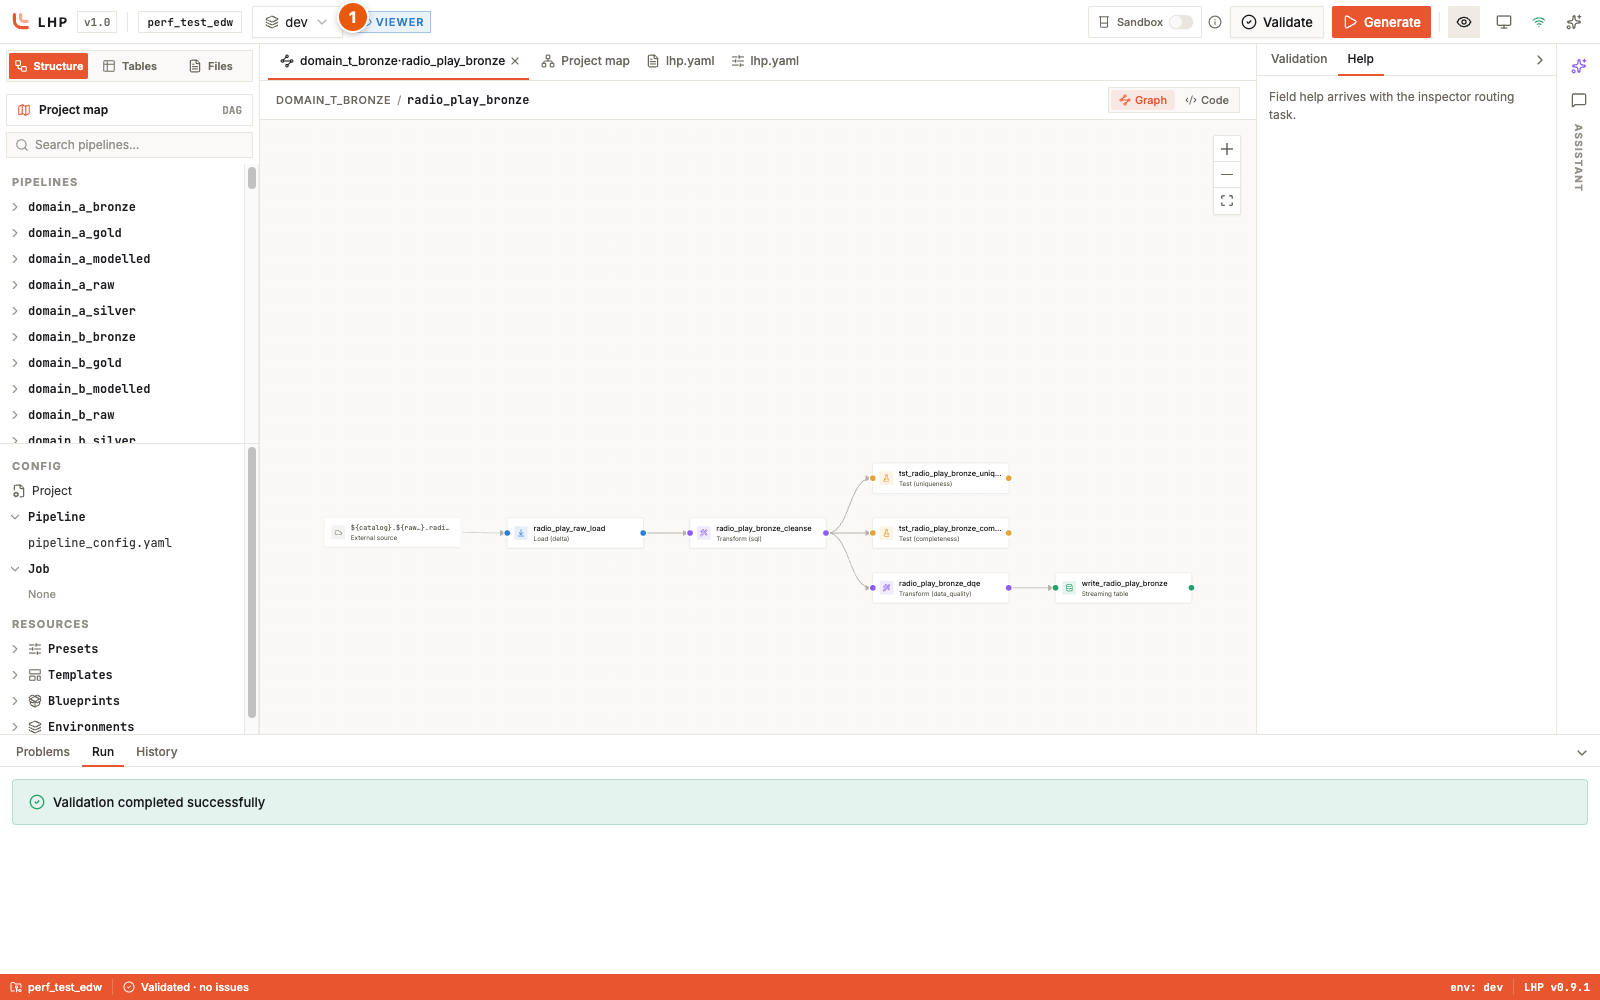
The read-only viewer lens: ① the VIEWER badge by the environment selector. The graph and code stay browsable; editing is suppressed.
The theme toggle beside it cycles system, light, and dark, following your OS preference by default.
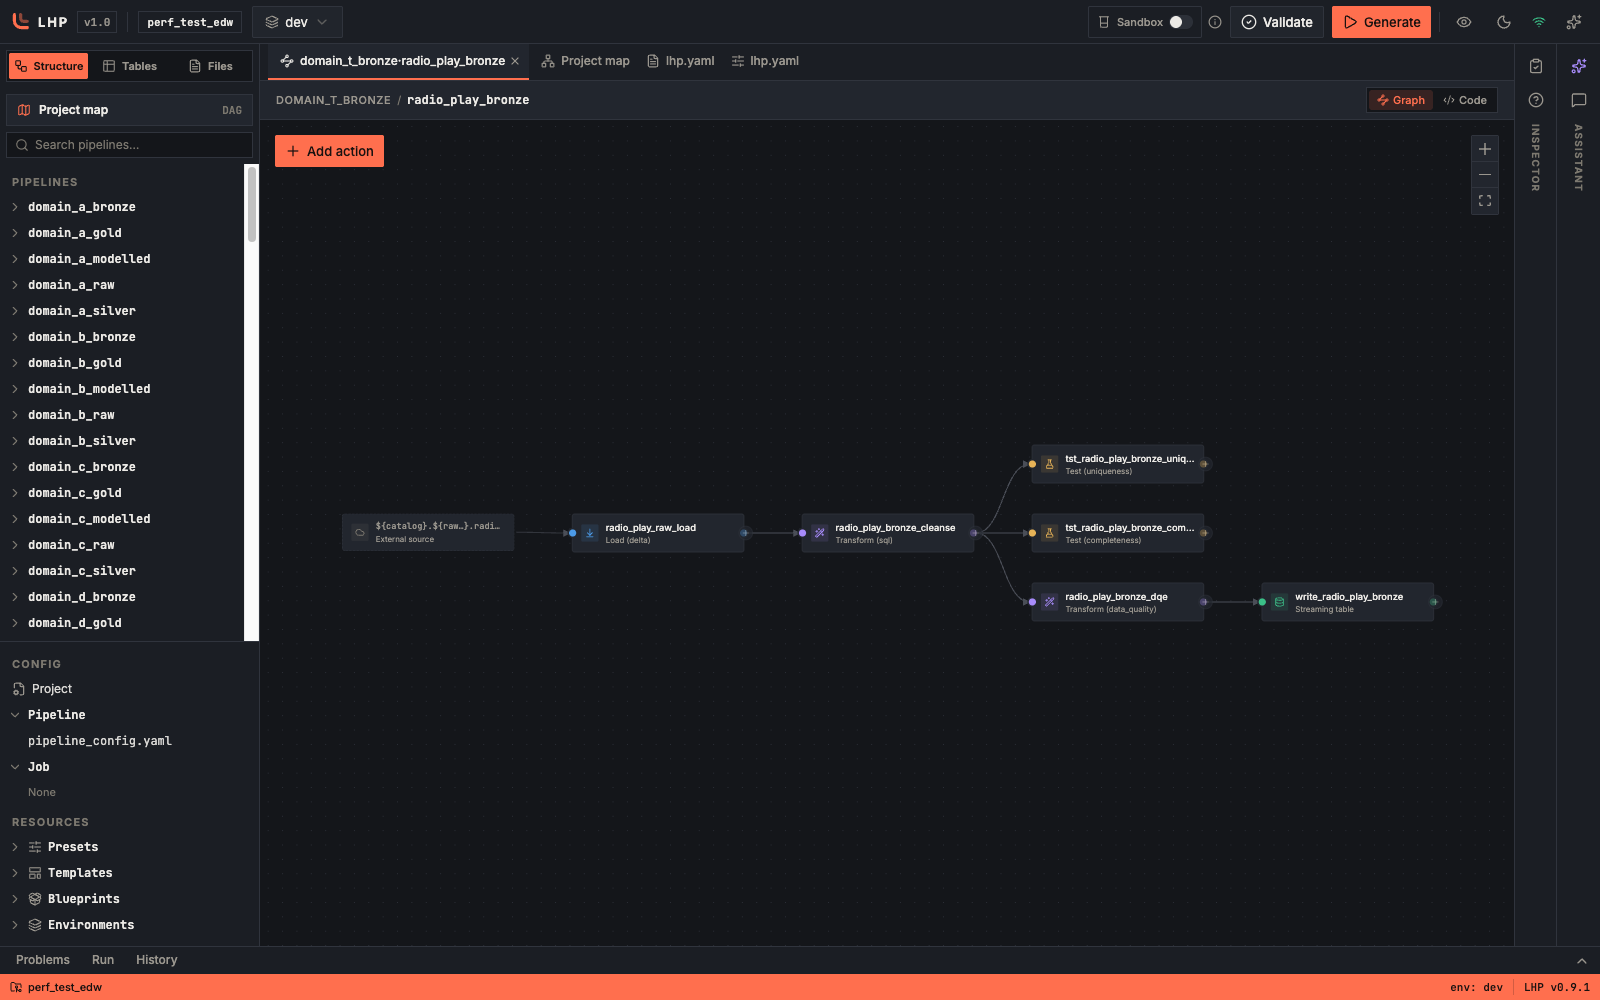
The same workspace in dark theme.
Scope IDE runs to a sandbox
The header carries a Sandbox toggle (“Developer-sandbox mode — generate only
your pipelines”) with an info button beside it. Turn it on and the IDE’s
validate and generate runs behave like lhp generate --sandbox: scoped
to your profile, with tables renamed into your own namespace so you build in
parallel without colliding with teammates. The same .lhp/profile.yaml and
the lhp.yaml sandbox: block govern the toggle and the CLI flag alike —
see Develop in a sandbox for the full workflow.
Start from an empty directory
To scaffold a brand-new project without running lhp init first, launch with
--allow-empty in an empty directory:
lhp web --allow-empty
Without the flag, lhp web refuses to start outside an initialized project.
With it, the IDE detects the missing lhp.yaml and serves an init wizard that
scaffolds the same project layout as lhp init. It does not create a git
repository.
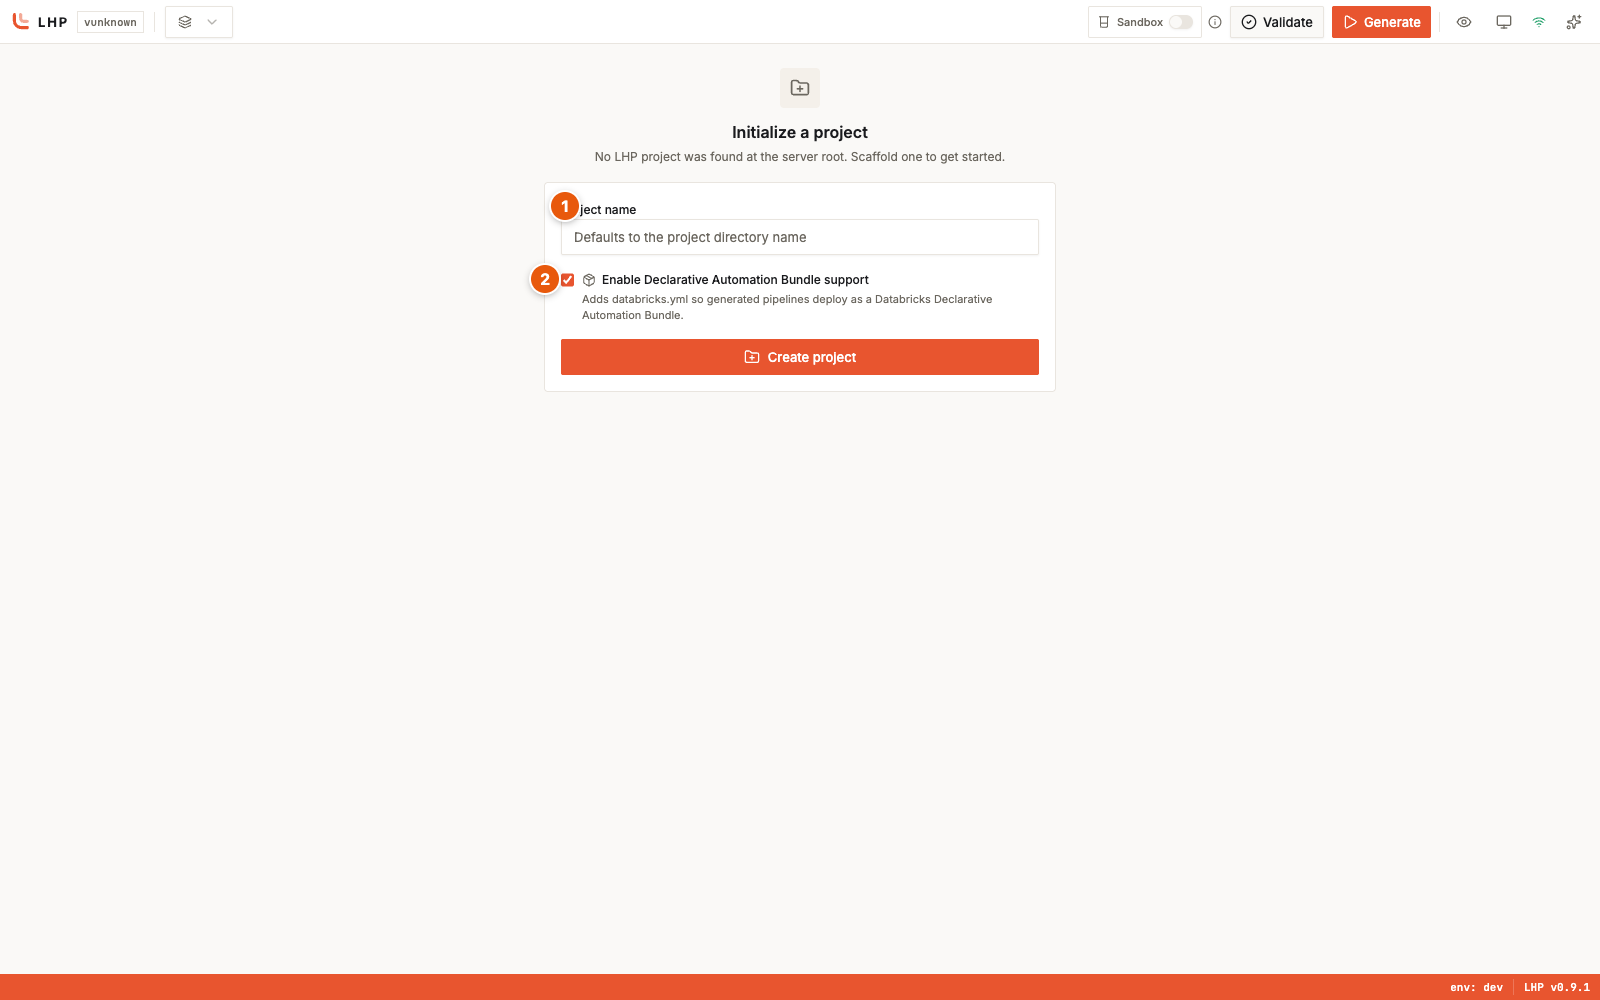
The init wizard served by --allow-empty: a “Initialize a project” card
with a project-name field (defaulting to the directory name), an “Enable
Declarative Automation Bundle support” checkbox that adds databricks.yml,
and a Create project button.
What the IDE does not do
The IDE is a local, single-user workbench, and its scope is deliberate:
No git integration. Commit, branch, and diff with your normal git tooling.
No Databricks deployment or execution. The IDE never connects to a workspace. Deploy generated code with Declarative Automation Bundles from the CLI or CI.
No integrated terminal, no multi-user or hosted mode. The server binds
127.0.0.1with no option to listen on a network interface.No accounts. The per-session URL token is the only access control.
What’s next
Chat with the AI assistant. The IDE includes an assistant panel that answers questions about your project and edits its files in place — see Get authoring help from the in-IDE assistant.
Develop against a shared environment. The sandbox workflow lets you build in parallel without colliding with teammates — see Develop in a sandbox.
See every flag. The full, generated
lhp weboption list lives in the CLI reference at CLI.